")
Cracking the Code of Activity Network Diagrams: A Complete Guide to Logical Project Planning
Every project, whether small or massive, runs on one core ingredient — logic. Without a clear sequence of tasks, deadlines slip, budgets inflate, and confusion takes over. This is where the Activity Network Diagram Guide steps in as a game-changer.
An Activity Network Diagram is more than a visual aid. It’s a structured logic map that organizes activities, defines dependencies, and helps identify the quickest route to project completion. In other words, it turns a complex project into a clear, navigable roadmap.
Activity Network Diagram Guide
In this guide, you’ll discover what an Activity Network Diagram is, why it matters, how to create one effectively, and how it can be applied in real-world scenarios across industries.
1. What Exactly is an Activity Network Diagram?
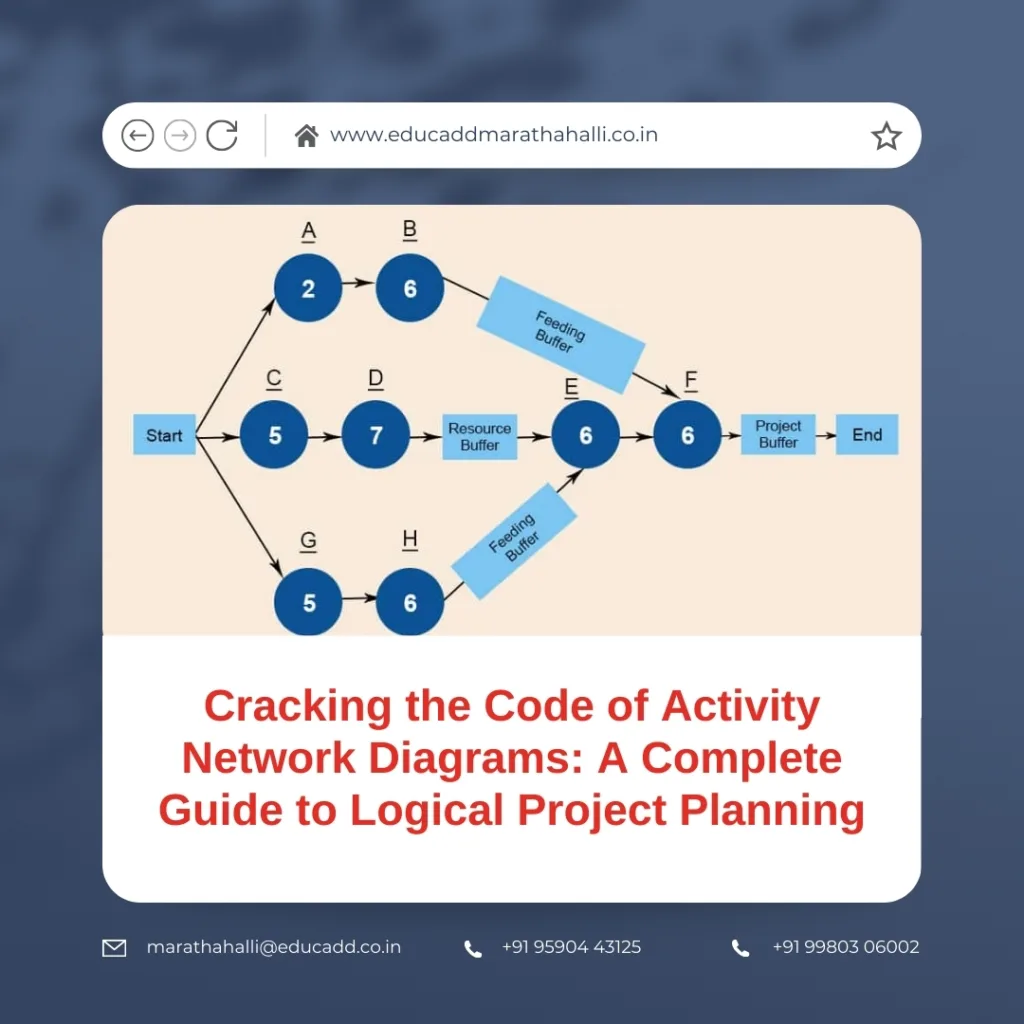
An Activity Network Diagram is a graphical tool used to plan and track a project’s sequence of activities. It connects each task in a logical order using nodes and arrows. The nodes represent activities, while the arrows show the order in which they must be performed.
This method reveals not just the tasks but also how they depend on each other. Some tasks can run simultaneously, while others must follow a strict sequence. By mapping these relationships, you can see the project’s “critical path” — the essential chain of tasks that dictate the minimum time needed to finish the project.
The diagram is especially valuable in large projects with multiple teams and overlapping activities. Instead of scattered to-do lists, you get a single, coherent map of the entire workflow.
2. How the Logic of the Diagram Works
The beauty of the Activity Network Diagram lies in its logical structure. Every arrow in the diagram answers a fundamental question: Which activity comes first, and which comes next?
Here’s how the logic flows:
-
Dependencies: Some activities must be completed before others start.
-
Parallel Tasks: Certain tasks can happen at the same time, speeding up progress.
-
Sequencing: Tasks are ordered so the project moves efficiently from start to finish.
This logical flow ensures nothing gets missed. It also makes delay points obvious. If a task on the critical path is delayed, the whole project timeline shifts. Knowing this in advance gives managers time to adjust schedules or resources to stay on track.
Think of it as a GPS for your project — it won’t just show you where to go but also alert you to roadblocks ahead.
3. Step-by-Step Process to Build an Activity Network Diagram
Creating an Activity Network Diagram involves more than drawing lines and boxes. It’s about translating your project plan into a clear, logical structure.
Step 1: Identify All Tasks
Start by listing every activity the project requires. No task is too small — even minor steps can affect the sequence.
Step 2: Define Task Dependencies
Ask: What needs to be finished before this can start? These answers form the connections in your diagram.
Step 3: Assign Time Estimates
Estimate how long each activity will take. Use realistic numbers based on experience or data to avoid surprises later.
Step 4: Plot the Diagram
Draw nodes for activities and arrows for dependencies. Arrange them so the flow moves from the project’s start point to its end point.
Step 5: Determine the Critical Path
Analyze the diagram to find the sequence of tasks that takes the longest. This becomes your critical path — your primary focus for ensuring timely delivery.
This step-by-step process transforms raw planning data into a visual guide that keeps everyone aligned.
4. Benefits of Using an Activity Network Diagram
The Activity Network Diagram delivers more than just a neat visual — it changes how projects are managed.
Clarity in Complexity
When dozens of tasks overlap, the diagram makes relationships and sequences visible at a glance.
Better Time Management
By knowing the critical path, you can prioritize key tasks and prevent delays from snowballing.
Enhanced Communication
A shared diagram ensures that every team member understands the same plan, reducing miscommunication.
Proactive Risk Handling
Dependency mapping makes it easier to spot and address potential bottlenecks before they impact deadlines.
Smarter Resource Use
You can allocate people, equipment, and budget exactly when and where they’re needed.
The result? Smoother execution, fewer last-minute surprises, and higher chances of meeting deadlines without burning out your team.
5. Where Activity Network Diagrams Make an Impact
The Activity Network Diagram is not tied to one industry. It adapts to almost any field that requires structured planning.
Construction and Engineering
From laying foundations to final inspections, task sequences are critical in building projects. The diagram keeps work on schedule.
Information Technology
Software development, testing, and deployment require precise coordination. Diagrams ensure features roll out in the right order.
Manufacturing
In production, a single delay can disrupt the entire assembly line. Mapping dependencies helps avoid costly downtime.
Event Planning
Weddings, conferences, and exhibitions rely on perfectly timed activities. Diagrams prevent clashes and delays.
Research and Development
Complex experiments often have prerequisites. Mapping these ensures smooth progress without duplication of effort.
In each of these areas, the diagram acts as a bridge between planning and execution, ensuring logic drives every move.
Conclusion: From Logic to Execution
An Activity Network Diagram is more than a scheduling tool — it’s the blueprint for a project’s success. By laying out tasks, defining dependencies, and identifying the critical path, it gives managers a level of control and foresight that simple lists or spreadsheets can’t match.
The logic behind the diagram keeps work flowing in the right order, prevents resource waste, and ensures deadlines are met. In today’s competitive environment, where delays can mean lost opportunities, this clarity is priceless.
When you master the creation and interpretation of an Activity Network Diagram, you move from reactive problem-solving to proactive planning. And that shift can be the difference between just completing a project and delivering it with excellence.

